BALTIMORE (Stockpickr) -- The S&P 500 is muscling its way to test new all-time highs this week, ratcheting the big index's 2014 gains back within grabbing distance of double-digits. That's a big about-face from the steep correction investors endured just a month ago.
Must Read: Warren Buffett's Top 10 Dividend Stocks
Factor in dividends, and the S&P's year-to-date performance sits at 11% and change.
And the good news for investors big index is still holding its uptrend very much intact as we head into the final stretch of the calendar year. But don't get too fixated on the indices in November – while more S&P upside is great, the big opportunities are showing up in the individual stocks...
That's why we're taking a technical look at five large-cap names worth trading this week...
First, a little on the technical toolbox we're using here: technicals are a study of the market itself. Since the market is ultimately the only mechanism that determines a stock's price, technical analysis is a valuable tool even in the roughest of trading conditions. Technical charts are used every day by proprietary trading floors, Wall Street's biggest financial firms, and individual investors to get an edge on the market. And research shows that skilled technical traders can bank gains as much as 90% of the time.
Every week, I take an in-depth look at big names that are telling important technical stories. Here's this week's look at five big stocks to trade this week.
Must Read: Sell These 5 Stocks Before It's Too Late
Total SA
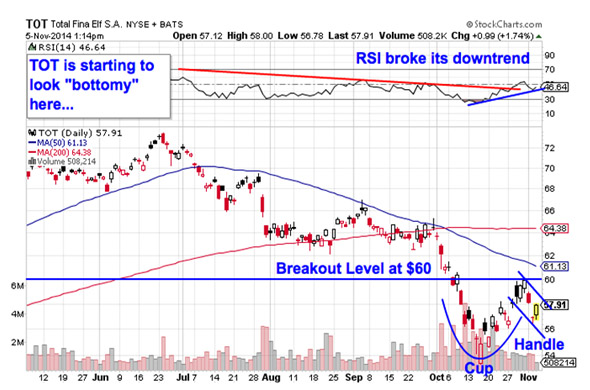
We'll start things out with a name that may come as a surprise, Total SA (TOT). Yes, the energy sector has gotten shellacked in recent months, and Total has been no exception: this $133 billion French oil and gas company is down almost 20% in the last six months. But while Total is down, it's not out yet – this stock looks ready for a reversal thanks to a classic technical price pattern.
Total is currently forming a "cup and handle pattern". The cup and handle is formed by a cup-shaped rounding bottom in shares that's followed up by a short-duration channel down. The buy signal comes on a move through the pattern's price ceiling at $60. A move through $60 tells us that buyers are squarely in control in IBM.
American Tower
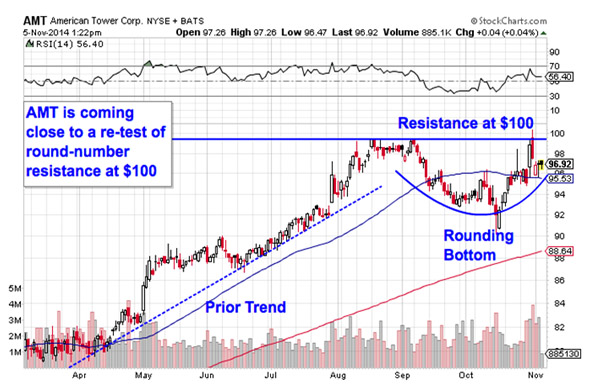
We're seeing a very similar price setup in shares of communications infrastructure firm American Tower (AMT). AMT is forming a rounding bottom pattern, the first part of the cup and handle setup that's been forming in Total. This isn't a particularly textbook trade – normally, rounding bottoms occur at the bottom of a downtrend, not at the top of a stock's range (like we're seeing now in AMT). That said, it's critical not to get fixated on how "textbook" a pattern looks; the trading implications are just the same here...
The buy signal in AMT comes on a breakout above resistance at $100.
Why all of that significance at that $100 level? It all comes down to buyers and sellers. Price patterns like the "rounding bottom" or the "cup and handle" are a good quick way to identify what's going on in the price action, but they're not the actual reason a stock is tradable. Instead, the "why" comes down to basic supply and demand for AMT's stock.
The $100 resistance level is a price where there has been an excess of supply of shares; in other words, it's a spot where sellers have previously been more eager to step in and take gains than buyers have been to buy. That's what makes a breakout above $100 so significant – the move means that buyers are finally strong enough to absorb all of the excess supply above that price level.
The 50-day moving average has started acting like a good proxy for support in AMT. I'd recommend parking a stop loss on the other side of the 50-day.
Must Read: 5 Big Stocks to Trade for Gains as QE3 Ends
Berkshire Hathaway
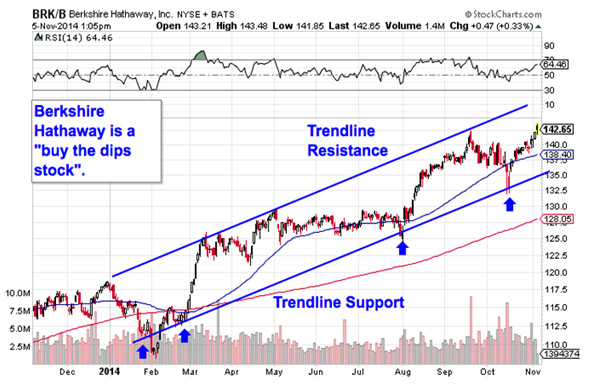
Berkshire Hathaway (BRK.A, BRK.B) is looking bullish this week – and you don't need to be an expert technical trader to see why. Instead, the setup in Berkshire is about as simple as they get: shares have been bouncing their way higher in a well-defined uptrending channel for all of 2014. Now, the next big buying opportunity comes on Berkshire Hathaway's next test of trendline support...
The channel in shares of Berkshire Hathaway is formed by a pair of parallel trendline support and resistance levels that identify the high-probability range for shares to stay within. Put more simply, Berkshire has been a "buy the dips stock" all year long, and now traders just need to wait for the next dip. That'll require a little patience, but if this stock's recent price action is any indication, that patience should pay off.
Berkshire's most recent swing low, at $132.50, is a smart level to park a stop loss order below. If that line in the sand gets violated, then the uptrend in Berkshire Hathaway is broken...
Must Read: 5 Breakout Stocks Under $10 Set to Soar
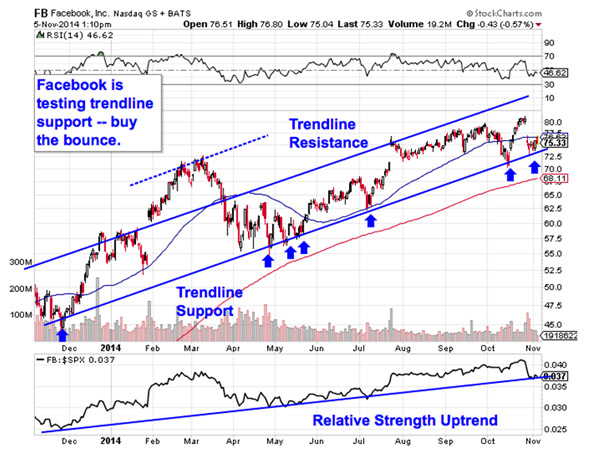
We're seeing the exact same price setup in shares of tech giant Facebook (FB) -- the big difference here is that the social network is actually looking buyable this week. Like Berkshire, Facebook has been in an uptrend for all of 2014 (in fact, FB's uptrend kicked off in December), and with shares testing support for the seventh time over the course of the uptrend, it makes sense to buy this next bounce.
Waiting for a bounce off of support is a critical test for two big reasons: it's the spot where shares have the furthest to move up before they hit resistance, and it's the spot where the risk is the least (because shares have the least room to move lower before you know you're wrong). Remember, all trend lines do eventually break, but by actually waiting for the bounce to happen first, you're ensuring FB can actually still catch a bid along that line before you put your money on shares.
EMC Corp.
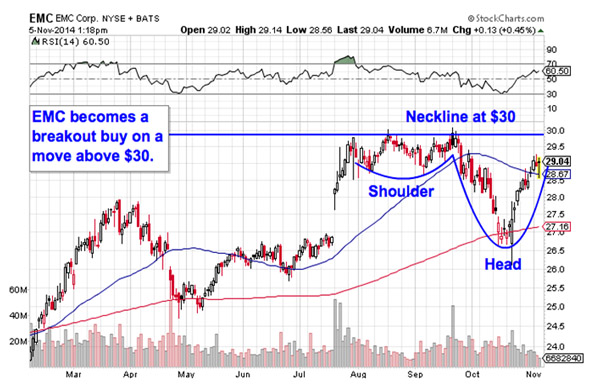
Last up on our list of big-name trades if $60 billion tech name EMC Corp. (EMC). EMC has been churning sideways for the past several months, but that churn is exactly what's making this stock look tradable this fall. Here's how to trade it:
EMC is in the early stages of forming an inverse head and shoulders setup, a bullish reversal pattern that indicates exhaustion among sellers. You can spot the inverse head and shoulders by looking for two swing lows that bottom out around the same level (the shoulders), separated by a bigger trough called the head; the buy signal comes on the breakout above the pattern's "neckline" level (that's the $30 price level in EMC).
Even though the right shoulder hasn't formed yet, any close above $30 from here is a buy signal in EMC. That's because $30 has been the level that's swatted shares lower since the last week of July – if EMC can suddenly catch a bid above $30, we've got our signal that buyers have taken control of this stock. When buyers make their move, it makes sense to join them...
-- Written by Jonas Elmerraji in Baltimore.
Must Read: Hedge Funds Hate These 5 Stocks -- Should You?
Follow Stockpickr on Twitter and become a fan on Facebook.
At the time of publication, author had no positions in the names mentioned.
Jonas Elmerraji, CMT, is a senior market analyst at Agora Financial in Baltimore and a contributor to TheStreet. Before that, he managed a portfolio of stocks for an investment advisory returned 15% in 2008. He has been featured in Forbes , Investor's Business Daily, and on CNBC.com. Jonas holds a degree in financial economics from UMBC and the Chartered Market Technician designation.
Follow Jonas on Twitter @JonasElmerraji
No comments:
Post a Comment