DELAFIELD, Wis. (Stockpickr) -- The stock market is once again under heavy selling pressure today, with the Dow Jones Industrial Average off by 139 points, the S&P 500 down by 13 points and the tech-heavy Nasdaq trending lower by 32 points.
>>3 Stocks Breaking Out on Big Volume
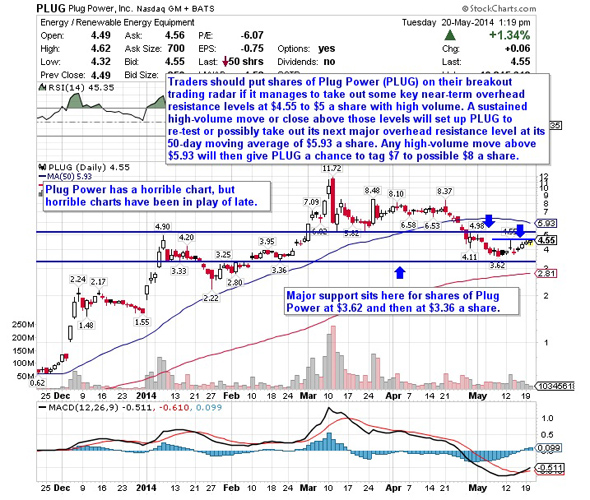
Despite the weak action in the markets, there's one group of stocks that traders continue to come after with force. That group is what I like to call "horrible charts." These oversold, beaten-down stocks with poor-looking technicals are where all the money is being made right now as large traders chase this group looking for quick rebound moves. This is a theme and pattern in the markets that I think is going to continue to play out, since there are so many candidates for this chart pattern.
Take, for example, the run we've seen in shipping player NewLead Holdings (NEWL) over the last few days. You'll be hard-pressed to find a worse-looking chart then NEWL over the last six months. Things got so bad for this company that last Thursday it announced a 1-for-50 reverse stock split for its common shares so that the company could maintain its compliance with being listed on the Nasdaq. Shares of NEWL are soaring higher today by 80% in a tough tape -- and the stock is up much more than that when you consider that its post-split low was 39 cents per share.
>>5 Rocket Stocks Ready for Blastoff
Horrible charts are in play for various reasons. In many of these names, the short-sellers have overstayed their welcome and pushed these stocks down to absurd levels. Then when the bulls start buying, the smart short-sellers are covering quickly, causing large spikes higher. In addition, many of these stocks have entered extremely oversold territory, and there isn't anyone left willing to sell these stocks down at their depressed levels.
Many traders are unwilling to go near these ugly charts, but that's a foolish way to approach the markets since this theme is trending and working in a tough market where the usual sector trends aren't playing out. This game is all about finding trends and exploiting what's working right in front of you, even if it's something you have avoided in the past. I like to think of it as playing in the sandbox that everyone else on Wall Street is playing in. If nobody is in your sandbox, it's probably time to find another one.
One beaten-down and extremely oversold that's not going down today is Plug Power (PLUG).
As I write this, shares of PLUG are trending modestly higher by 1.4% to around $4.50 per share. Shares of Plug Power have been slammed lower by the sellers over the last three months, with shares down sharply from its 52-week high of $11.72 a share to its recent low of $3.62 a share. That's a massive slide lower and Plug Power didn't help the cause after the company recently announced some large secondary offerings.
Plug Power has a market cap of $613 million and an enterprise value of $514 million. This stock currently trades at a premium valuation, with a forward price-to-earnings of 227. Its estimated growth rate for this year is 67.6%, and for next year it's pegged at 118.2%. This is a cash-rich company, sine the total cash position on its balance sheet is $63.23 million and the total debt is just $3.61 million
Recently, Cowen upgraded shares of Plug Power to outperform from market perform. The firm mentioned that it took a tour of the company's factories and saw a high level of activity for its GenKey fuel cell product. The firm also said that strong year-to-date bookings should lead to fourth-quarter profitability, and Plug Power's strong cash position should enable it to develop new products, expand into Asia and support its expansion into the hydrogen generation market. Cowen cut its price target on PLUG to $6 from $7.50 based on higher expenses and new shares issues by the company.
From a technical perspective, shares of Plug Power has been downtrending badly over the last three months, with shares moving lower from its 52-week high of $11.72 to its recent low of $3.62 a share. That said, shares of PLUG have for now stopped its downtrend once the stock hit is low of $3.62 a share, which corresponds with a previous low back in February around $3.36 a share. This bounce off that $3.62 low could be signaling a bottom is in for shares of PLUG in the near-term and this stock is now quickly moving within range of triggering a major breakout trade.
Traders should look for long-biased trades in PLUG if it manages to break out above some key near-term overhead resistance levels at $4.55 to $5 a share with high volume. Look for volume on that move that hits near or above its three-month average action of 48.10 million shares. If that breakout launches soon, then PLUG will set up to re-test or possibly take out its next major overhead resistance level at its 50-day moving average of $5.93 a share. Any high-volume move above $5.93 will then give PLUG a chance to tag $7 a share.
Traders can look to buy shares of PLUG off weakness as long as it's trending above some near-term support at around $4 a share. One can also just buy PLUG off strength once it takes out those breakout levels with volume and then simply use a stop that sits a comfortable percentage point from your entry.
This is a heavily shorted stock, since the current short interest as a percentage of the float for Plug Power is sits at around 20%. Those shorts have banked big coin over the last three months, but I have a sneaking feeling that they've started to cover some of their trades and are now flipping to the long side.
The bottom line: Horrible charts are working in this market, and shares of Plug Power currently have all the characteristic of a horrible chart. A solid trading opportunity could be developing for this horrible chart soon and there are already plenty of short-sellers involved in this name. If we see further strength for shares of PLUG in the near-term, then this horrible chart could turn into a great trade if it breaks out above the key resistance levels I highlighted on the chart.
-- Written by Roberto Pedone in Delafield, Wis.
RELATED LINKS:
>>3 Big Stocks to Trade (or Not)
>>5 Stocks Set to Soar on Bullish Earnings
>>Sell These 5 Toxic Stocks Before It's Too Late
Follow Stockpickr on Twitter and become a fan on Facebook.
At the time of publication, author had no positions in stocks mentioned.
Roberto Pedone, based out of Delafield, Wis., is an independent trader who focuses on technical analysis for small- and large-cap stocks, options, futures, commodities and currencies. Roberto studied international business at the Milwaukee School of Engineering, and he spent a year overseas studying business in Lubeck, Germany. His work has appeared on financial outlets including
CNBC.com and Forbes.com. You can follow Pedone on Twitter at www.twitter.com/zerosum24 or @zerosum24.
No comments:
Post a Comment