In August of 2011, the United States went through a similar take-it-to-the-brink brush with meeting its debt ceiling. Volatility in markets surged at that time, and the VIX more than tripled. While it is trite to say that history never repeats exactly, it remains a useful warning. Past is also often prologue, and so I think it is instructive to look at what happened in the late summer of 2011 as the US approached the debt ceiling then and glean from that what may be in store this time.
The debt ceiling is the total amount the US can borrow and is currently set at $16.7 trillion. Like most modern nations, the US uses deficit spending, or borrowing money to finance expenditures that exceed revenues. Neither side of the congressional aisle has a difficulty with deficit spending per se; the issue has become the perception that it has gone too far. Legislated ceilings on the amount the US can borrow have been put in place to attempt to force fiscal discipline. The problem has become similar to the parent who lacks the resolve to properly discipline their unruly child: threats are issued of consequences for repeat offenses, but are not followed through on. Since 1960, congress has raised the debt ceiling an astonishing 78 times. That averages out to about 1.5 increases per year. Debt ceilings have been raised under both Republicans and Democrats: (source: pewresearch.org)
(click to enlarge)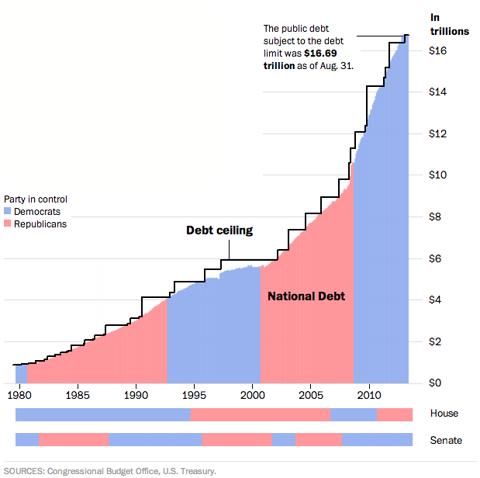
A failure to raise the debt ceiling has the potential to cause the US to default on its debts, which could have disastrous effects on the economy.
Performance of the VIX
The VIX is the best known measure of volatility. The CBOE Volatility Index, VIX
is a key measure of market expectations of near-term volatility conveyed by S&P 500 stock index option prices. Since its introduction in 1993, VIX has been considered by many to be the world's premier barometer of investor sentiment an! d market volatility. (source: cboe.com)
The VIX measures investor expectations of volatility in the coming thirty days. This is accomplished by aggregating data on various options premiums. It is often referred to as the "fear gauge" as options premiums tend to rise during market declines as hedging activity increases to protect portfolios. VIX has undergone various changes in its computation methodology over the years, but differences in composition are subtle, and so comparisons with other years, while not perfect, for the most part remain valid. So far, year to date 2013 has seen an average VIX of 14.17, a maximum value of 20.49 and a minimum value of 11.3. The reading at time of writing is 19.48, above average as one would expect given the looming debt ceiling crisis. During 2011 the average VIX level was 24.2 with a minimum of 14.62 and a maximum of 48. (source: all figures from CBOE.com)
VIX During The Last Debt Crisis
The VIX made a massive spike during 2011.
(click to enlarge)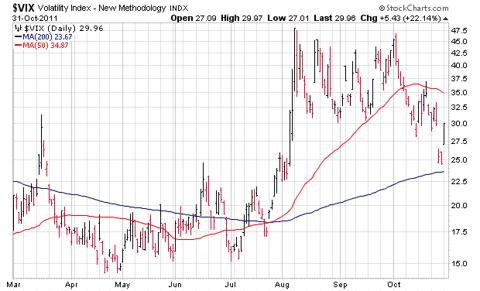
During the month of July, 2011, as talks were heating up between Democrats and Republicans, the VIX rose from a level of 15 to 25, a 67% increase over the course of one month. But the real move, the move from 25 to 48, a move of 92% was accomplished in just four trading days from August 3 to August 8. The astonishing thing is that move happened after the August 1 announcement that the impasse had been solved and the debt ceiling would increase $2.1 - $2.4 trillion, allowing the government to continue to operate into 2013. It would appear the market feared more the government continuing its spending than it feared the government shutting down. This fear was punctuated by S&P downgrading the US debt upon the ceiling being increased.
To give some historical perspective to those 2011 VIX levels, since the beginning of 2007 the average VIX level has been 23.62, the minimum has ! been 9.89! and the maximum 80.86.
Investing in the VIX
One cannot purchase the VIX directly, but one can purchase a reasonable facsimile in the form of IPath S&P 500 Short Term Futures ETN (VXX) which seeks to replicate, net of expenses, the S&P 500 VIX Short-Term Futures Total Return Index. The VXX buys
exposure to a daily rolling long position in the first and second month VIX futures contracts and reflects the implied volatility of the S&P 500 Index at various points along the volatility forward curve. The index futures roll continuously throughout each month from the first month VIX futures contract into the second month VIX futures contract"(source: yahoo finance profile description of VXX)
The typical situation for VIX futures is that second month prices are higher than first month prices, a condition known as contango. This contango causes inherent price decay or negative roll yield as the premium for future months erodes while the future approaches the current date. This condition works against holders of the VXX, and it is for this reason that it is recommended as a short term investment only. Hold periods of a day to a few weeks are commonly recommended.
5 Best Cheap Stocks To Watch For 2014
But for rare periods, contango reduces and can turn into its opposite, backwardation, the condition where front month futures are priced higher than subsequent futures. Under backwardation, the roll yield becomes positive, price decay turns into price accretion. The normal situation is one of contango and backwardation exists for usually a day or two only.
Backwardation in 2011 and Now
In a highly unusual situation, the VIX was in a state of backwardation for 76 continuous days from August 1 2011 through November 15, 2011. The average amount of backwardation during that time was 7.67% and the maximum backwardation was 27.12%. This became a significant tail wind ! for VXX i! nvestors reducing or eliminating the cost of holding VXX over longer periods.
(click to enlarge)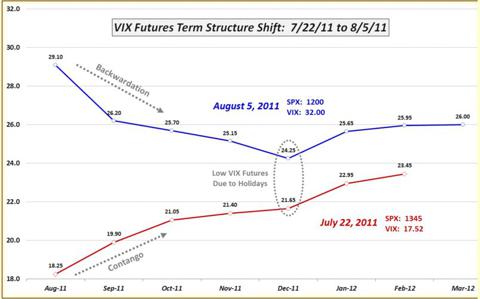
VIX has recently gone back into backwardation. No one can say for sure how long it will stay backwardated, but for now this backwardation assists VXX investors and shows investor perception is heightened about volatility in the short term.
Conclusion
Estimates currently point to October 17 as the day when the US government will run out of money and no longer be able to pay its bills and risk defaulting on its debts. Politicians and lawmakers from both parties have demonstrated their willingness in the past to take issues right to the brink. It appears likely that the brink will be approached again this time. With 10 days remaining, it also seems likely that investors will continue to want to hedge portfolios until a solution is in hand. This suggests that options premiums will continue to rise, which will put upward pressure on the VIX. This, coupled with the VIX term structure being in backwardation, makes for a strong case for short term investment in VXX. Further, the fact that VIX remains well below the extreme levels reached in past crises implies significant upside for investors willing to tolerate high levels of volatility.
Source: Volatility And The Last Debt Ceiling Crisis: A Lesson From HistoryDisclosure: I am long VXX. I wrote this article myself, and it expresses my own opinions. I am not receiving compensation for it (other than from Seeking Alpha). I have no business relationship with any company whose stock is mentioned in this article. (More...)
No comments:
Post a Comment